In the current dynamic trading environment, having access to free live Nifty charts with technical indicators is now essential rather than optional. These charts provide real-time insights into market movements and are invaluable for traders looking to make informed decisions. Whether you are a beginner experimenting with trading strategies or an experienced investor, having the appropriate tools can make all the difference.
This blog explores how you can analyze trends, spot opportunities, and improve your trading strategy without breaking the bank by using free live Nifty charts enhanced with crucial technical indicators. Please continue reading to learn how to use these charts for trading success, where to find them, and their salient characteristics.
Why Use Free Live Nifty Charts with Technical Indicators?

Accessing a reliable source of live Nifty charts with integrated technical indicators can significantly enhance your trading decisions and strategies. These charts combine real-time market updates with powerful analytical tools, making them a must-have for traders at any skill level. Here’s what they give you,
1. Analyze Market Trends
Live Nifty charts allow you to spot bullish and bearish patterns as they develop. With the candle formation in the charts, you can easily predict the patterns, which will help identify the overall market trends.
The famous candlestick patterns for bullish reversal are,
- Bullish Engulfing
- Hammer
- Inverted Hammer
- Dragonfly Doji
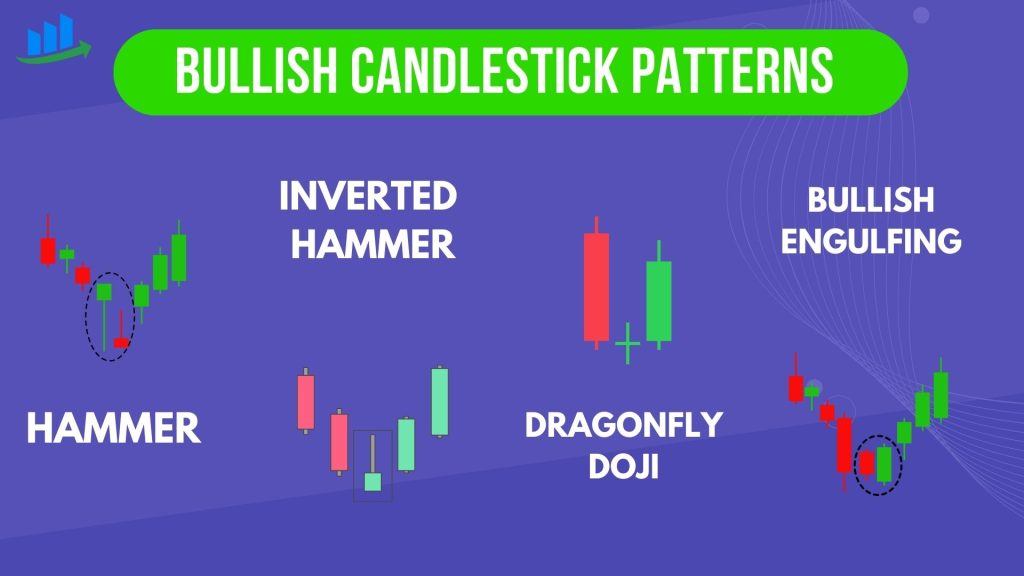
Bullish Patterns
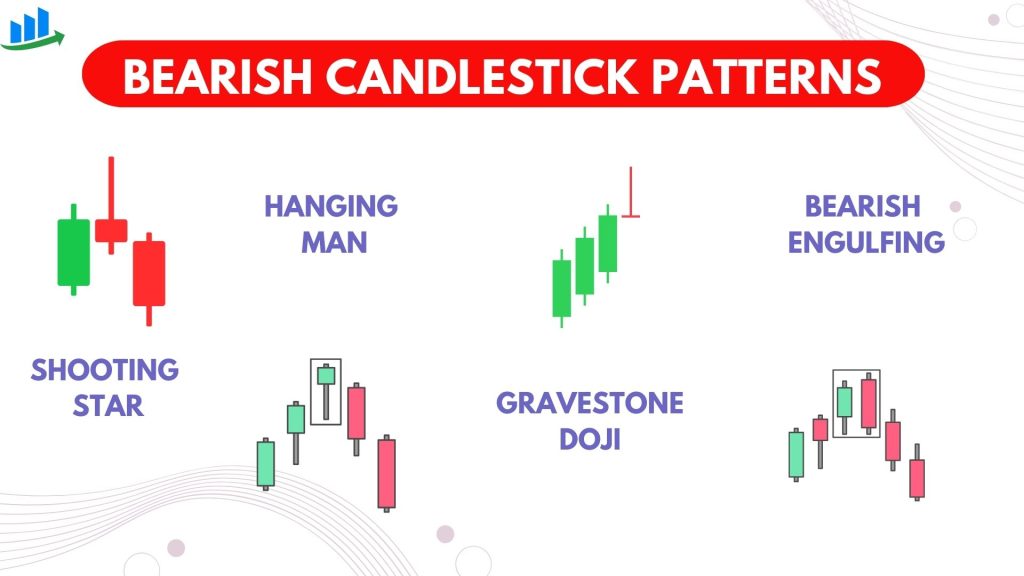
The renowned candlestick patterns for bearish reversal are,
- Shooting star
- Hanging man
- Gravestone Doji
- Bearish Engulfing
Bearish Patterns
With the help of predefined chart patterns, traders can predict the market direction in advance and make informed decisions.
The three key points to read the chart patterns are,
- Identify the overall market trend (uptrend, downtrend, or sideways).
- Monitor key price movements, such as breakouts, pullbacks, or consolidations.
- Recognize critical support and resistance levels where price action tends to reverse or pause.
By analysing these trends in real-time, you can anticipate market behaviour and position your trades to align with the prevailing momentum.
2. Use Information to Make Better Choices
Relying on technical indicators such as RSI (Relative Strength Index), MACD (Moving Average Convergence Divergence), and moving averages allows you to make decisions backed by data rather than emotions. For instance:
RSI highlights overbought or oversold conditions, helping you avoid buying at peaks or selling at troughs.

MACD provides insights into trend strength and potential reversals, ensuring you’re not caught off guard by sudden shifts.

Moving averages smooth out price fluctuations, enabling you to identify the direction of the trend and its sustainability.

3. Time Your Trades
Real-time updates on live Nifty charts allow you to optimise your entry and exit points, which are critical for profitability. Here, I have selected the CRISIL (Equity stock) with the best movement today

- Entry Points: Identify moments when the market aligns with your strategy, such as a price breakout above resistance or bounce-off support.
- Exit Points: Spot opportunities to take profit or cut losses, such as when an indicator signals weakening momentum or a trend reversal.
4. Experiment Without Risk
Free platforms offering live Nifty charts give you the freedom to experiment with various indicators and strategies at no cost. This is especially beneficial for:
New traders: Learn how different indicators work and gain confidence without financial pressure.

Experienced traders: Test advanced strategies, tweak existing methods, and refine approaches to stay ahead of the curve.
Where to Find Free Live Nifty Charts:
Several platforms and tools are offering free Nifty charts with comprehensive technical indicators:
1. TradingView
- Free plan available with community-driven scripts for unique strategies.
- Offers real-time Nifty charts with advanced charting features.
- Provides access to over 100 technical indicators.

2. Google Finance
- Ideal for beginners starting their market journey.
- Simplified live Nifty charts for quick analysis.

3. Investing.com,

- Comprehensive charts with multiple indicators.
- Allows you to save and compare analysis across sessions.
4. Stockcharts.com

Conclusion:
Start using live Nifty charts today to make smarter trading decisions and stay ahead in the market. These tools can help you trade more confidently and effectively—don’t miss out on the advantage they bring!
Free Nifty live charts for Amibroker