
If you are an Amibroker user looking for historical stock data, access to 20 years of NSE (National Stock Exchange) End-of-Day (EOD) data can significantly improve your analysis and backtesting. This blog will cover everything you need to know about downloading and using NSE EOD data for Amibroker. Whether you’re an investor, trader, or developer, having accurate historical data is essential for fine-tuning your strategies.
What is EOD data?
EOD (End-of-Day) data refers to the stock market data recorded at the close of each trading day. It summarises the day’s market activity for individual stocks, indices, or other securities. EOD data is essential for traders and investors who want to analyze trends, backtest strategies, or make informed decisions without tracking real-time fluctuations.
Why Do You Need 20 Years of NSE EOD Data?
1. Backtesting Strategies
Backtesting allows traders to test the effectiveness of a strategy by applying it to historical market data. With 20 years of NSE EOD data, traders can simulate trades over different market cycles—such as bull, bear, or sideways markets.
This long-term data helps determine 6how a strategy would have performed in the past, allowing traders to make adjustments and improve the approach before using it in live trading. Strategies tested over multiple years tend to be more reliable because they account for a variety of market conditions.
2. Pattern Recognition and Trend Analysis
Certain trends and patterns only become visible when viewed over a long period. For example, analyzing stock price movements over 20 years allows traders to identify recurring patterns, such as cyclical market behavior or seasonal trends. For example, here I have loaded the chart of SBIN. In SBI, we can see the pattern of using the EOD data.
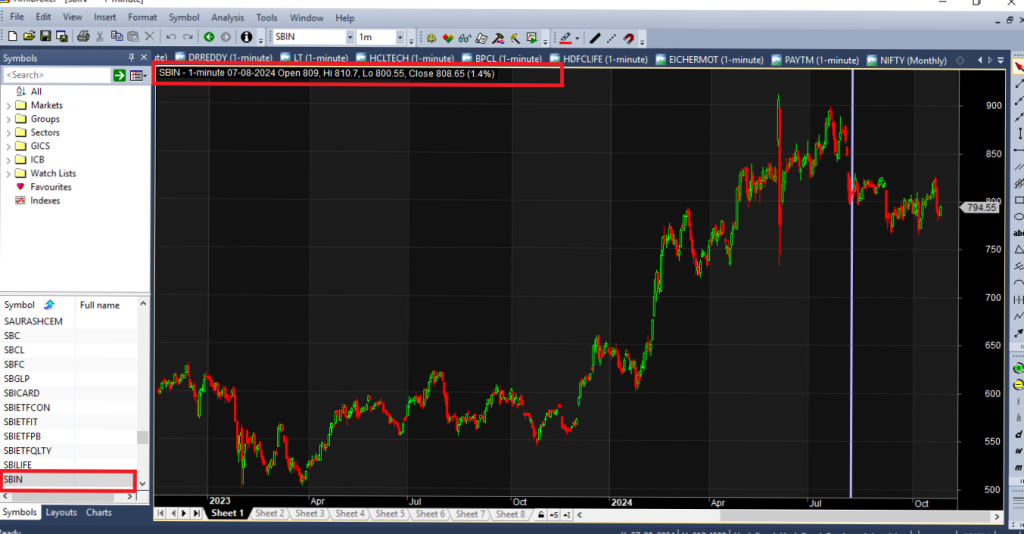
These insights help traders develop strategies based on long-term signals rather than relying on short-term price fluctuations, leading to more stable and predictable trading outcomes.
3. Portfolio Analysis and Optimization
Investors looking to build or rebalance their portfolios benefit from historical EOD data. By reviewing stock and index performance over 20 years, they can identify which assets perform well during different market phases.
Long-term EOD data also helps investors spot correlations between different securities, enabling better diversification. Additionally, it allows for portfolio optimization by assessing returns and risks over an extended period, leading to more informed asset allocation decisions.
4. Volatility Assessment for Risk Management
Volatility plays a critical role in managing trading risks, especially when setting stop losses or determining position sizes. With 20 years of data, traders can analyse historical volatility trends for individual stocks or indices. This allows them to understand how much price fluctuation is typical for an asset and adjust their risk management rules accordingly. For example, look at the chart of LT foods. It is volatility
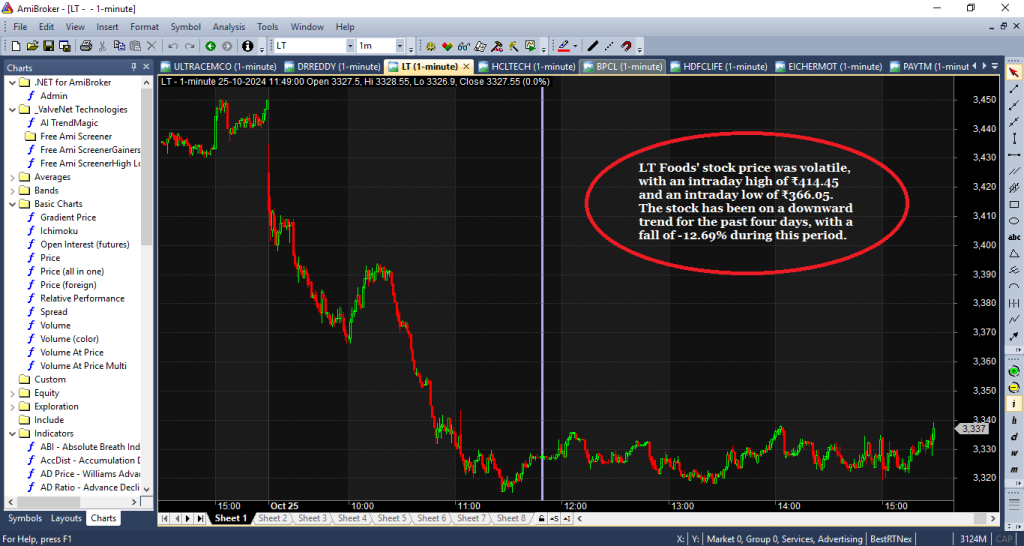
Accurate volatility assessments reduce the chances of premature stop losses being triggered and help traders set realistic expectations for trade outcomes
Who Needs NSE EOD Data for Amibroker?
1. Technical Analysts: Leveraging Indicators like Moving Averages, RSI, and MACD
Technical analysts depend heavily on indicators like Moving Averages (MA), Relative Strength Index (RSI), and Moving Average Convergence Divergence (MACD) to forecast future price movements. These indicators rely on historical price and volume data, which makes reliable EOD data crucial. Here’s how they use it:
- Moving Averages (MA):
Analysts use short-term and long-term moving averages (like the 50-day and 200-day MAs) to identify trends. Access to 20 years of EOD data allows them to validate crossover strategies (e.g., Golden Cross, Death Cross) by observing how the market behaved over different timeframes.
- RSI (Relative Strength Index):
RSI helps determine whether a stock is overbought or oversold. Having long-term data allows analysts to assess how the RSI indicator has behaved during market corrections or rallies, providing insights on whether to enter or exit a position.
- MACD (Moving Average Convergence Divergence):
MACD is used to spot trend reversals and momentum shifts. Access to 20 years of data enables analysts to backtest how well MACD signals performed historically, helping them refine their strategies for the present market.
By using long-term EOD data, technical analysts can better understand how indicators perform under various market conditions, ensuring their strategies are not just effective in the short term but also robust over time
2. Algo Traders: Backtesting Algorithms with Historical Data
Algorithmic traders depend on precise and comprehensive historical data to fine-tune their automated trading systems. For developers working on algorithms, the ability to test strategies on multiple years of EOD data is essential before deploying them in live markets. Here’s why:
- Model Calibration and Optimization:
Algorithms need to be optimized for different market phases (bullish, bearish, and flat). By testing on 20 years of data, developers ensure that their algorithms can perform consistently across various market cycles.
- Minimising Overfitting:
One of the biggest challenges in algorithmic trading is avoiding overfitting—where a strategy works well on past data but fails in live markets. With access to decades of data, algo traders can test their algorithms on different periods and ensure they generalise well.
- Stress Testing for Unusual Market Events:
Historical data from the last 20 years includes major financial events, such as the 2008 global financial crisis and the COVID-19 crash in 2020. Developers can stress test their algorithms using these periods to see how their systems would have reacted under extreme conditions.
3. Amibroker Users: Backtesting and Simulations for Strategy Validation
Amibroker is a popular platform for technical analysis, strategy development, and backtesting, and it requires high-quality EOD data to perform effectively. Here’s how Amibroker users benefit from long-term EOD data:
- Accurate Simulations:
Amibroker allows traders to simulate how their strategies would have performed in the past. To get reliable results, they need complete EOD data for multiple years. Gaps or incorrect data can lead to misleading backtest results, reducing the reliability of the strategy.
- Creating and Testing Custom Indicators:
Amibroker users often design their own custom indicators and trading systems using AFL (Amibroker Formula Language). Having access to 20 years of EOD data helps them assess how their custom indicators behave over time and refine them based on historical performance.
- Identifying Market Conditions for Strategy Tuning:
Different strategies work better in different market conditions. For instance, trend-following strategies thrive during bull runs, while mean-reversion strategies are effective in flat markets. With 20 years of EOD data, Amibroker users can tune their strategies to suit specific market conditions.
- Portfolio Backtesting:
Amibroker users often test their strategies across a basket of stocks or indices to see how well their system performs as a portfolio. Long-term EOD data allows them to evaluate overall portfolio performance and ensure diversification benefits over time.
Where to get 20 years of EOD data?
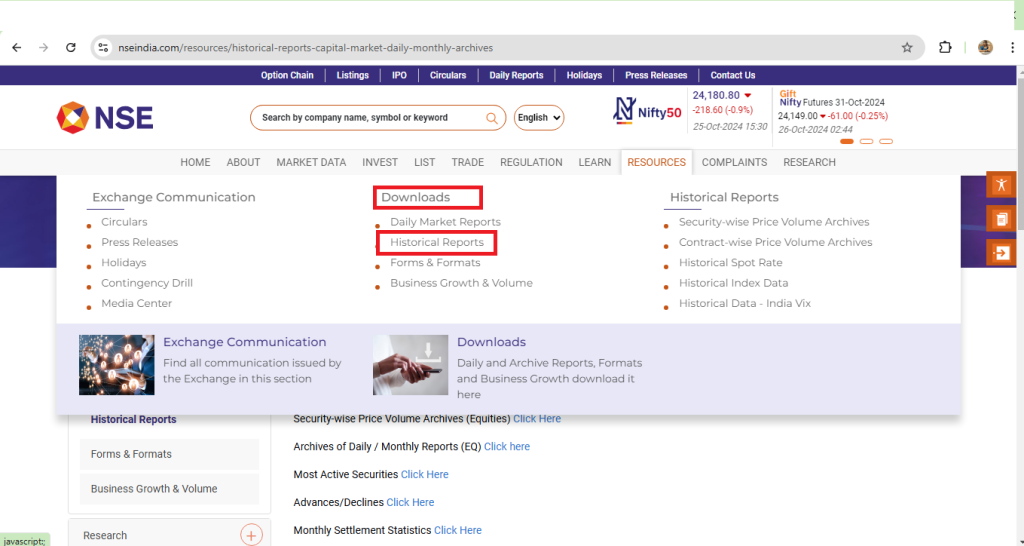
1. NSE India Website (Official Source)
The NSE India website offers historical EOD data for various stocks, indices, and segments (like equities and derivatives). Although it might require manual downloads for different periods, it is a free and reliable source for traders who prefer official data.
Features:
- Data is available in CSV format for equity and indices.
- Option to download multiple years, though limited to batches.
How to Access:
- Go to www.nseindia.com.
- Navigate to the Historical Data section under Market Data.
2. ValveNet Technologies – BestRTNex App
ValveNet Technologies offers BestRNex, a data feeder tool that delivers NSE EOD data directly into Amibroker. With BestRTNex, users can backfill 20 years of historical data for multiple stocks, ensuring they have clean and accurate datasets.
Features:
- 20 years of NSE EOD data for seamless backtesting.
- Direct integration with Amibroker.
- Includes tutorials for easy setup.
How to Access:
Visit the ValveNet Technologies website, purchase access to BestRTNex, and download the feeder tool.
3. Yahoo Finance (Free Alternative)
Yahoo Finance offers free historical data, including EOD prices for individual stocks and indices like Nifty 50. While it may not cover all the stocks, it’s a decent option for users looking for basic data without a subscription.
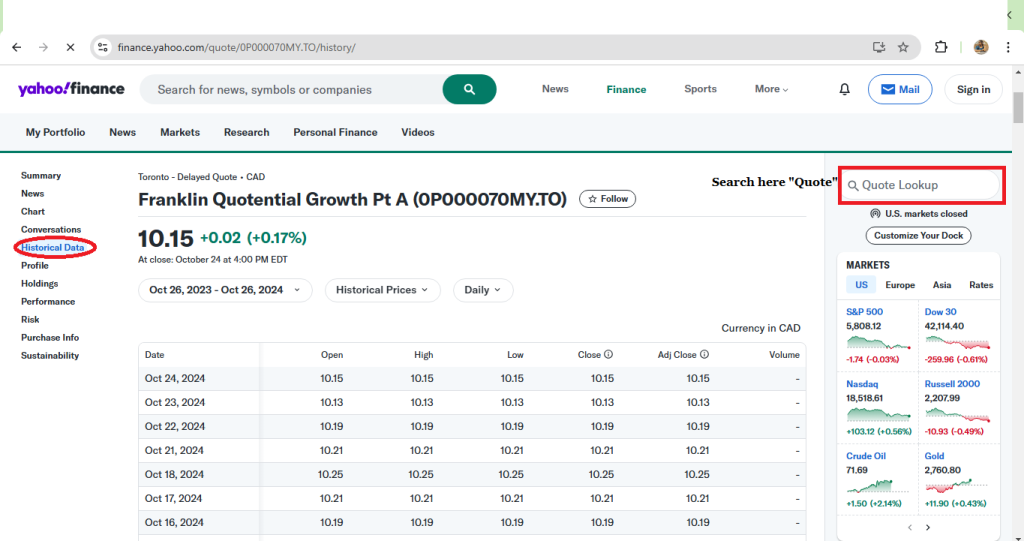
Features:
- Free data for stocks, indices, and ETFs.
- Downloadable in CSV format.
How to Access:
- Search for the stock or index on Yahoo Finance, go to the “Historical Data” tab, and download the required period.
How to Download 20 Years NSE EOD Data for Amibroker?
Here’s a step-by-step guide on getting NSE EOD data into Amibroker:
Here I have downloaded from ValveNet Technologies. You can download it from any other source of your choice.
Step 1: Download the Amibroker (Updated version) and BestRTNex data feeder
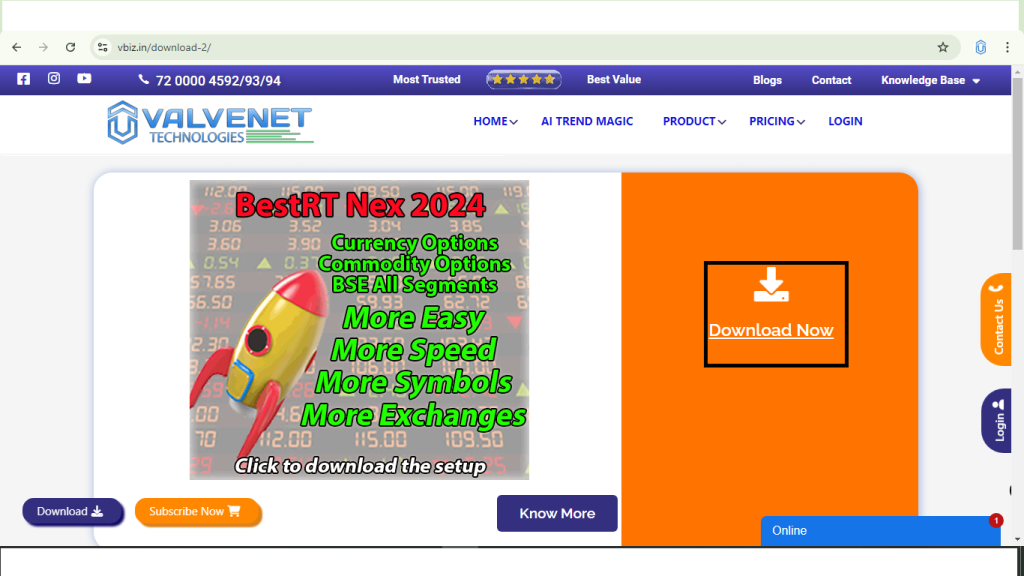
First, visit the ValveNet Technologies website and get access to the BestRTNex app. This app will let you download both Amibroker and the data feeder tool, which provides NSE End-of-Day (EOD) data.
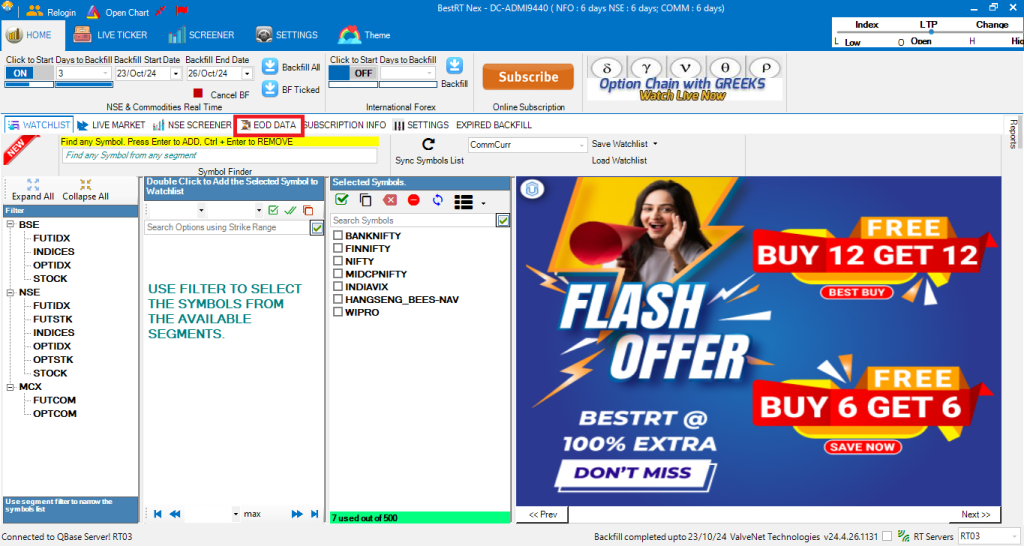
Step 2: Select stocks & Open the Feeder App
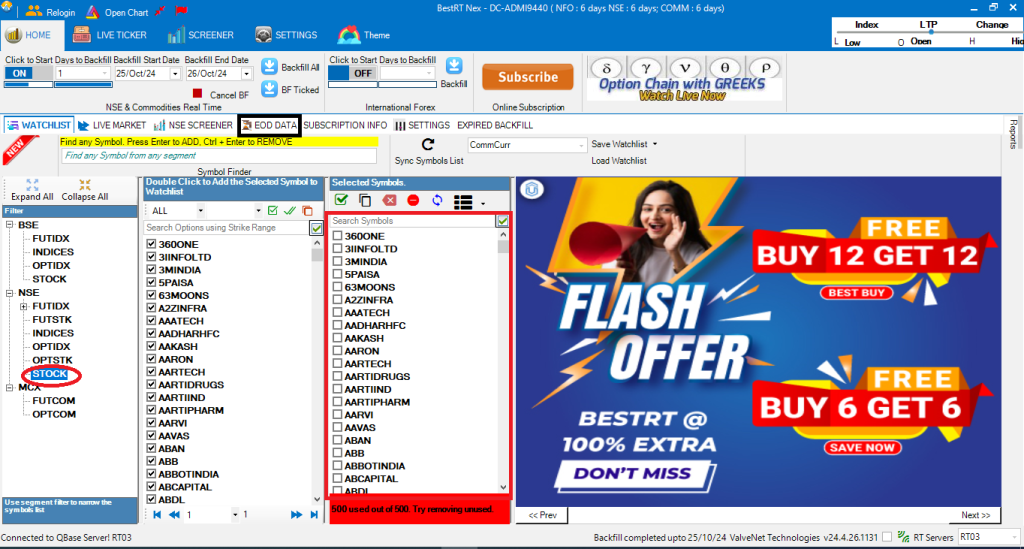
After installing Amibroker and the Feeder app, open the Feeder. Choose the stocks you want EOD data for, then switch on the feeder—it will automatically load the NSE data into Amibroker.
Step 3: Backfill historical EOD data
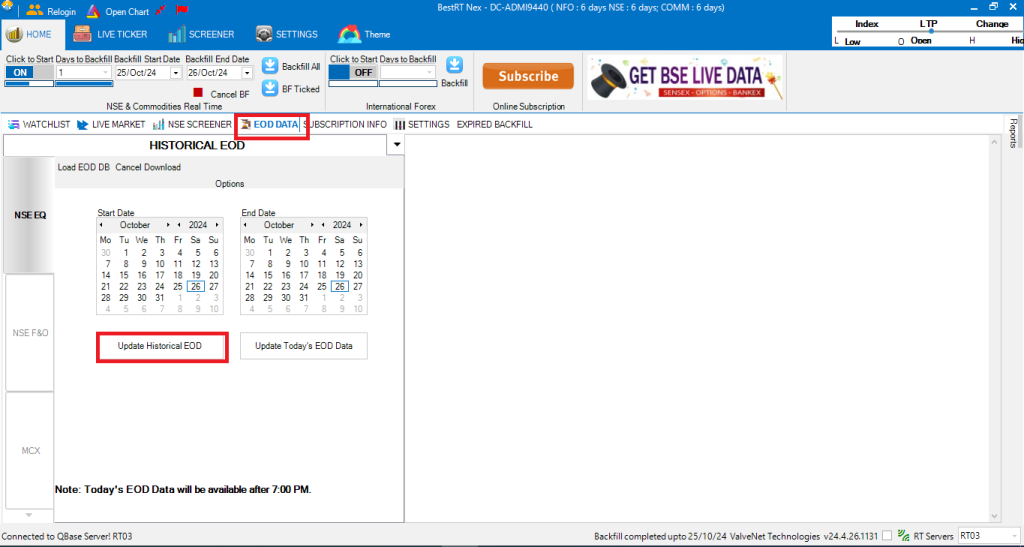
In the BestRTNex Feeder app, go to the EOD data section for NSE stocks. Click the backfill option to download 20 years of historical EOD data for the stocks you selected in Amibroker.
That’s it! In just a few steps, you now have 20 years of accurate NSE historical data inside Amibroker. You’re ready to use Amibroker’s backtesting tools with long-term NSE data.
Using NSE EOD Data for Strategy Backtesting in Amibroker
After importing the data, you can test your strategies. Here’s how:
- Load the Stock Ticker: In Amibroker, select the desired stock or index.
- Set the Time Range: Configure backtesting for the last 20 years.
- Run the Test: Use your trading rules to generate buy/sell signals.
- Analyze Results: Review metrics like profit factor, win rate, and maximum drawdown.
Conclusion
Access to 20 years of NSE EOD data is invaluable for traders, analysts, and algo developers looking to build reliable strategies, conduct portfolio analysis, and manage risk effectively.
With EOD data in hand, you’ll be well-equipped to develop strategies that can withstand different market conditions and enhance your trading performance over time.


